library(tidyverse)
d <- haven::read_sav("../data/Voegele_Bachl_2017.sav") |>
  mutate(schwab = as_factor(schwab))
m <- lm(gesamt ~ schwab, data = d)Hallo
Methoden II: Methoden der empirischen Kommunikations- und Medienforschung
Freie Universität Berlin
14. 04. 2025
Agenda
- Hallo
- Tell me why
- Vorkenntnisse
- Aufbau der Vorlesung
- Hausaufgabe
- Updates vom Studiengangskoordinator Ansgar Koch
Hallo
Hallo

Arbeitsstelle Digitale Forschungsmethoden
CV
Seit Mai 2023 Juniorprofessor Digitale Forschungsmethoden an der FU Berlin
Davor: Universität Hohenheim (PhD, Postdoc), Hochschule für Musik, Theater und Medien Hannover (Master, Gastprofessor), Universität Augsburg (Bachelor)
2021-2023 Associate Editor von Communication Methods and Measures
2018-2022 Sprecher der DGPuK-Fachgruppe Methoden
Doktorarbeit zur statistischen Analyse rezeptionsbegleitend gemessener Kandidatenbewertungen in TV-Duellen
Tell me why
Tell me why

giphy.com
Tell me why
Wissenschaftliche Lektürekompetenz: Wenn man aktuelle Forschung lesen möchte (oder muss), führt kein Weg an etwas komplexeren Analysen vorbei.

The thematic analysis of the disinformation narratives was structured by using the three-step coding framework of the grounded theory approach (e.g., Charmaz, 2006). Specifically, initial unstructured open coding was followed up by focused and axial coding to map variety on the themes resulting from the data.
Tell me why
Wissenschaftliche Lektürekompetenz: Wenn man aktuelle Forschung lesen möchte (oder muss), führt kein Weg an etwas komplexeren Analysen vorbei.

The meta-analyses were conducted in the R (version 4.3.1) statistical platform using the metaSEM package (Cheung, 2023). […] We used a random-effects model instead of a fixed-effects model as we did not assume that the included studies could represent the entire population of interest (Hunter & Schmidt, 2000).
Tell me why
Wissenschaftliche Lektürekompetenz: Wenn man aktuelle Forschung lesen möchte (oder muss), führt kein Weg an etwas komplexeren Analysen vorbei.

Multi-level logistic regression analysis was employed to test the hypotheses, because of the dependent variables’ dichotomous nature and nested structure of the data.
Tell me why
Wissenschaftliche Lektürekompetenz: Wenn man aktuelle Forschung lesen möchte (oder muss), führt kein Weg an etwas komplexeren Analysen vorbei.

The methods of textual analysis and grounded theory were used to explore social practices, representations, assumptions, and stories. The process was cyclical and interactive between researcher and data (Corbin, 2016), from an initial stage during which texts were read for familiarity, to deeper levels of analysis of linguistic and grammatical structures […], to the emergence and consolidation of common stories and themes.
Tell me why
Wissenschaftliche Lektürekompetenz: Wenn man aktuelle Forschung lesen möchte (oder muss), führt kein Weg an etwas komplexeren Analysen vorbei.

Due to overdispersion in retweet counts, we used negative binomial regression with weekly aggregated data to test if discourse types, network structures, and dynamics predicted issue-related retweets (H1 and H2).
Tell me why
(Einstieg in die) Anwendungskompetenz: Wer Analysen praktisch nachvollzogen hat, kann in Seminar- und Abschlussarbeiten darauf aufbauen.
Tell me why
(Einstieg in die) Anwendungskompetenz: Wer Analysen praktisch nachvollzogen hat, kann in Seminar- und Abschlussarbeiten darauf aufbauen.
Call:
lm(formula = gesamt ~ schwab, data = d)

Residuals:
    Min      1Q  Median      3Q     Max
-2.8098 -0.6050  0.1902  0.3950  1.3950

Coefficients:
            Estimate Std. Error t value Pr(>|t|)
(Intercept)  3.80982    0.06860  55.538   <2e-16 ***
schwabJa    -0.20482    0.09242  -2.216   0.0273 *
---
Signif. codes:  0 '***' 0.001 '**' 0.01 '*' 0.05 '.' 0.1 ' ' 1

Residual standard error: 0.8758 on 361 degrees of freedom
Multiple R-squared:  0.01342,   Adjusted R-squared:  0.01069
F-statistic: 4.912 on 1 and 361 DF, p-value: 0.0273Tell me why
(Einstieg in die) Anwendungskompetenz: Wer Analysen praktisch nachvollzogen hat, kann in Seminar- und Abschlussarbeiten darauf aufbauen.
Tell me why
Alltagswissen: Fähigkeiten für gesellschaftliches Leben und den Arbeitsmarkt
- Konsument:innen und Produzent:innen empirischer Evidenzen
- Mis-/Dis-/False Information
- AI: Modern-Day Oracles or Bullshit Machines? How to thrive in a ChatGPT world
- …
Tell me why
- Wissenschaftliche Lektürekompetenz
- (Einstieg in die) Anwendungskompetenz
- Alltagswissen
- Pragmatisch: Prüfungsrelevant
Tell me why
Was haben die Backstreet Boys und Lineare Regression gemeinsam?


Vorkenntnisse
Vorkenntnisse

Aufbau der Vorlesung
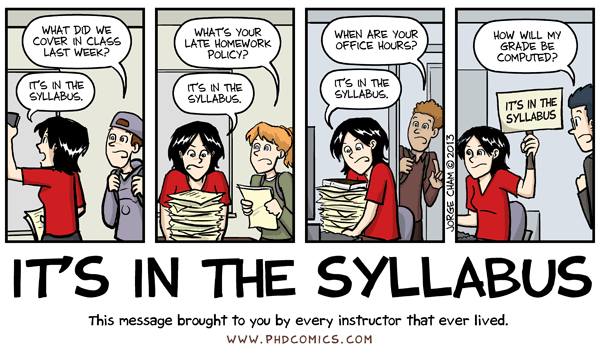
Syllabus
Link in Blackboard
Lernziele
- Studierende können die Anwendung ausgewählter Analyseverfahren nachvollziehen sowie entsprechende Ergebnisse und Interpretationen in der Forschungsliteratur verstehen.
- Studierende haben ein Basiswissen zur Anwendung ausgewählter Analyseverfahren, auf das sie in eigenen Analysen aufbauen können.
- Studierende verfügen über die Kompetenz, Angemessenheit und Güte von methodischen Vorgehensweisen zu beurteilen.
- (Bonus: Studierende finden Statistik und Datenanalyse weniger schlimm und langweilig.)
Voraussetzungen (1/2)
- Gute Kenntnisse der uni- und bivariaten Datenanalyse oder die Bereitschaft, sich diese spätestens bis zur Wiederholungssitzung anzueignen.
- Grundsätzliches Verständnis der frequentistischen Inferenzstatistik oder die Bereitschaft, sich dieses spätestens bis zur Wiederholungssitzung anzueignen.
- Bei großem Nachholbedarf: Bachelor-Vorlesung Methoden II: Einführung in die Wahrscheinlichkeitstheorie und Statistik; Montag, 10-12 Uhr, HFB/D
- Gutes Verständnis der Inhalte aus der VL Methoden I (Joachim Trebbe). Insbesondere Verständnis für die Datenstrukturen, die sich durch die Erhebung mit den jeweiligen Methoden ergeben.
Voraussetzungen (2/2)
- Bereitschaft, sich eigenständig mit den Grundlagen der Datenanalyse in R vertraut zu machen.
- Dies umfasst das Verstehen, Bearbeiten und Ausführen einfacher Befehle zur Datenanalyse und vor allem die Interpretation der Ausgaben.
- Es umfasst nicht Datenmanagement und Durchführen vollständiger Datenanalysen mit R. Dafür gibt es eine Methodenübung.
Ablauf der Sitzungen
- Besprechung der praktischen Übungen/Hausaufgabe (max. 15 min)
- Vorlesungsteil (max. 60 min)
- Fragen und Antworten zur Vorlesung und praktischen Übung
Leistungen
- Vorlesung: Keine Anwesenheitspflicht für Studierende, aber auch keine Nachhilfepflicht für Lehrende
- Aktive Teilnahme: Übungsaufgaben zur Datenanalyse (Vertrauensbasis, klausurrelevant)
- Klausur (Gesamtmodulprüfung, E-Examination):
- Kurz nach Ende der Vorlesungszeit (genauer Termin folgt), Anmeldung erforderlich (folgt)
- Datenerhebung (VL I, Joachim Trebbe) und Datenanalyse (VL II)
- Umfang: 120 Minuten (Auswahlfragen, Textantworten, ggf. Analyse mit R)
Praktische Übungen
- In oder nach jeder Sitzung eine praktische Übung, meist auf Basis einer publizierten Studie
- Kurze Besprechung in der Vorlesung, meist mit einer exemplarischen Analyse; keine Zeit zum Lösen individueller technischer Probleme
- R-Code zum Replizieren der Analysen zu Hause oder während der Vorlesung
- Einstieg in die Anwendungskompetenz: Anpassung von bestehendem Code
- Mehr: Methodenübung, R for Data Science
Material
Material der Vorlesung
- Vorlesung ist Work-in-Progress:
- Anpassungen nach Vorkenntnissen, Fortschritt, Erfahrungen
- Folien in der Regel kurz vor der Vorlesung verfügbar
- HTML-Folien werden in hier bei der jeweiligen Sitzung verlinkt.
- Weiteres Material vorläufig in Blackboard🔒
- Folien als PDF, Code, Daten
Vorlesungsplan

Vorlesungsplan im Syllabus; Comic: https://phdcomics.com/comics.php?f=1583
Rahmenbedingungen

Rahmenbedingungen im Syllabus; Comic: https://phdcomics.com/comics.php?f=1583
Hausaufgaben
Hausaufgabe (1/2)
Klären Sie, wie Sie R und RStudio für die Übungen zur Vorlesung nutzen können.
- Beste Variante: Installation von R und RStudio auf eigenem Computer (Anleitung).
- Alternative 1: Nutzung der öffentlichen Computerräume (z.B. ZEDAT, Bibliothek, Zugang und Verfügbarkeit checken)
- Alternative 2: Browser-basierte Version
- Alternative 3: Nutzung eines kostenlosen Accounts auf Posit.Cloud
Hausaufgabe (2/2)
Fügen Sie den folgenden Code ein und führen Sie Ihn aus. Wenn Sie ein Histogramm sehen, ist Ihr Gerät bereit für die Vorlesung.

Nächste Woche

Saalfelder Eierbaum, fotografiert von AndrewPoison
Nächste Sitzung (in zwei Wochen)
Wiederholung: Univariate & bivariate Beschreibung von Daten
Fragen?
Danke — bis zur nächsten Sitzung.
Marko Bachl


